
The journal: education
How to Identify a Liquidity Sweep on NAS100 (Step-by-Step)
You already know what a liquidity sweep is — price takes out resting orders at a key level and reverses. But recognizing one on a live Nasdaq chart, in real-time, while the candle is printing? That's a different skill entirely.
This post breaks down exactly how to identify sweeps on Nasdaq. Not in hindsight. Not on a textbook diagram. On a live chart, during the session that matters.
Step 1: Map the Liquidity Levels Before the Session
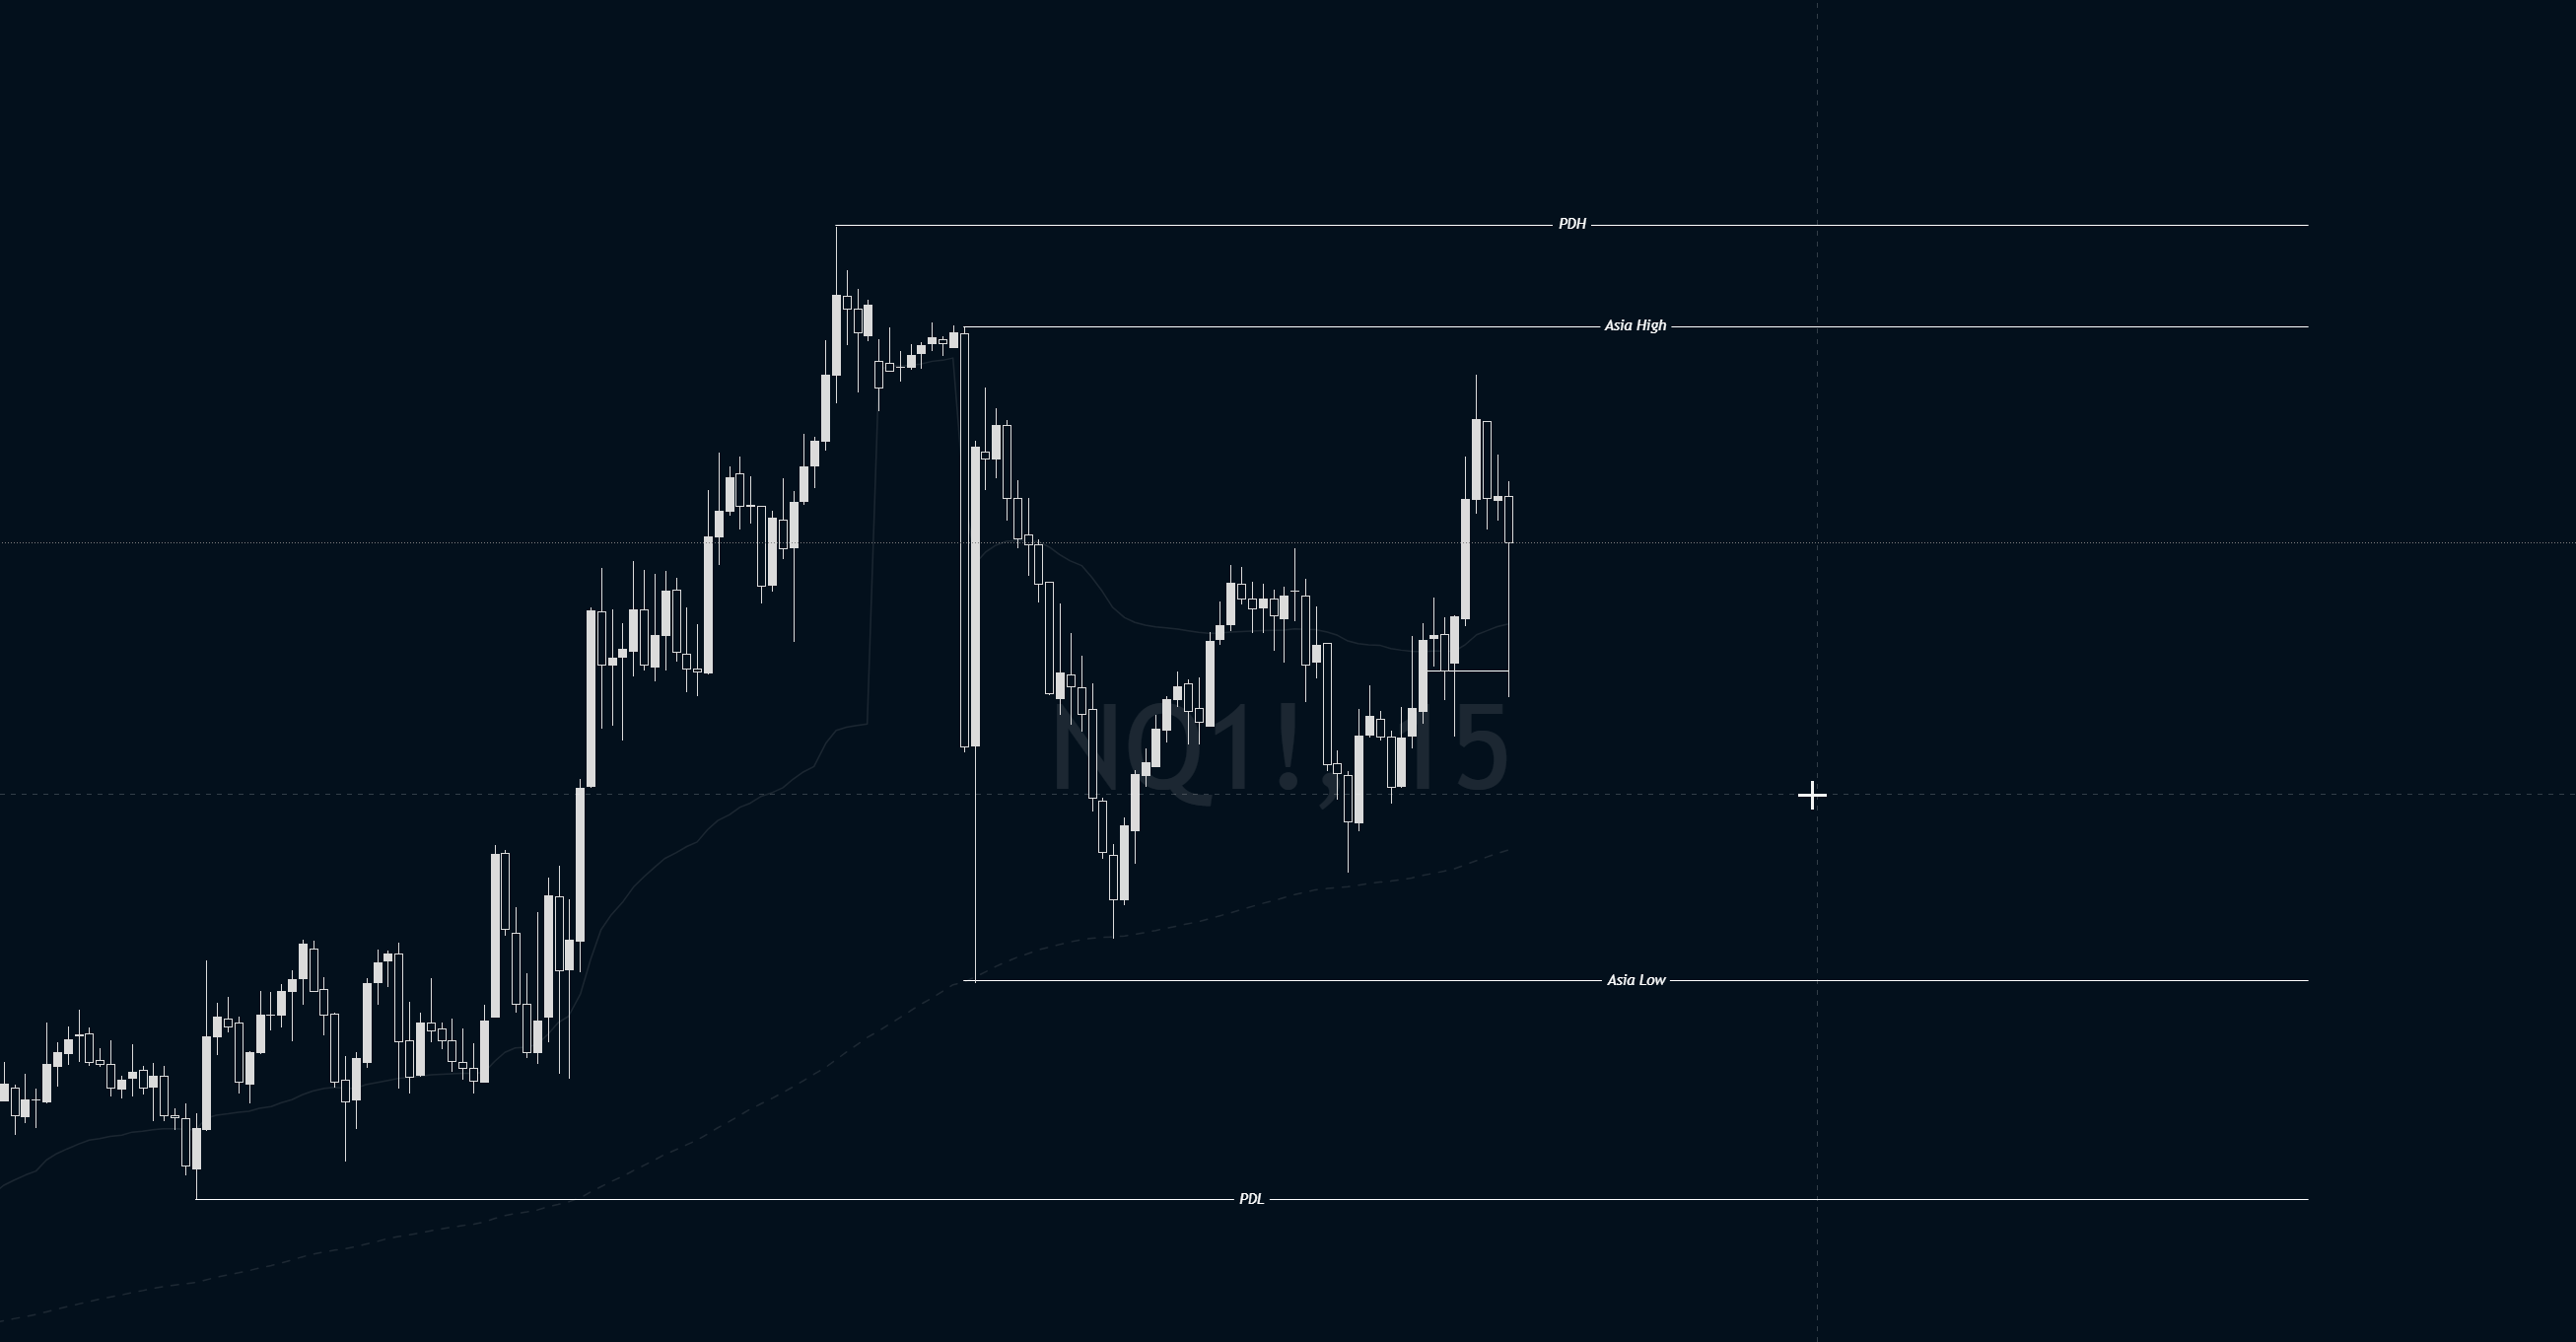
Before the 9:30 AM ET open, mark these levels on your chart:
- Previous Day High (PDH) and Previous Day Low (PDL) — the most common targets for NY AM sweeps
- Overnight High and Overnight Low — the range price built during Asia and London
- Asia session High/Low — 8:00 PM – 12:00 AM ET range extremes
- London session High/Low — 2:00 AM – 5:00 AM ET range extremes
- Equal highs or equal lows — any price level tested twice without breaking through
These are the magnets. Price doesn't sweep random levels. It targets levels where retail stop losses are clustered — and those clusters form at obvious highs, lows, and double-touches.
Mark all of these on your chart before the session opens, using session pivot lines (AS.H, LO.L, etc.) so you can see them at a glance once price starts moving.
Step 2: Wait for the Right Session
Not all sweeps are equal. The highest-probability sweeps on Nasdaq happen during the NY AM session (9:30 – 11:00 AM ET). This is when participation peaks — US equities are open, volume surges, and the large orders that drive sweeps actually have the liquidity to fill.
Sweeps outside this window still occur, but they're less reliable. Asia and London session sweeps on Nasdaq tend to be thinner, with less follow-through.
If you're only going to watch one window, this is the one.
Step 3: Watch for the Raid
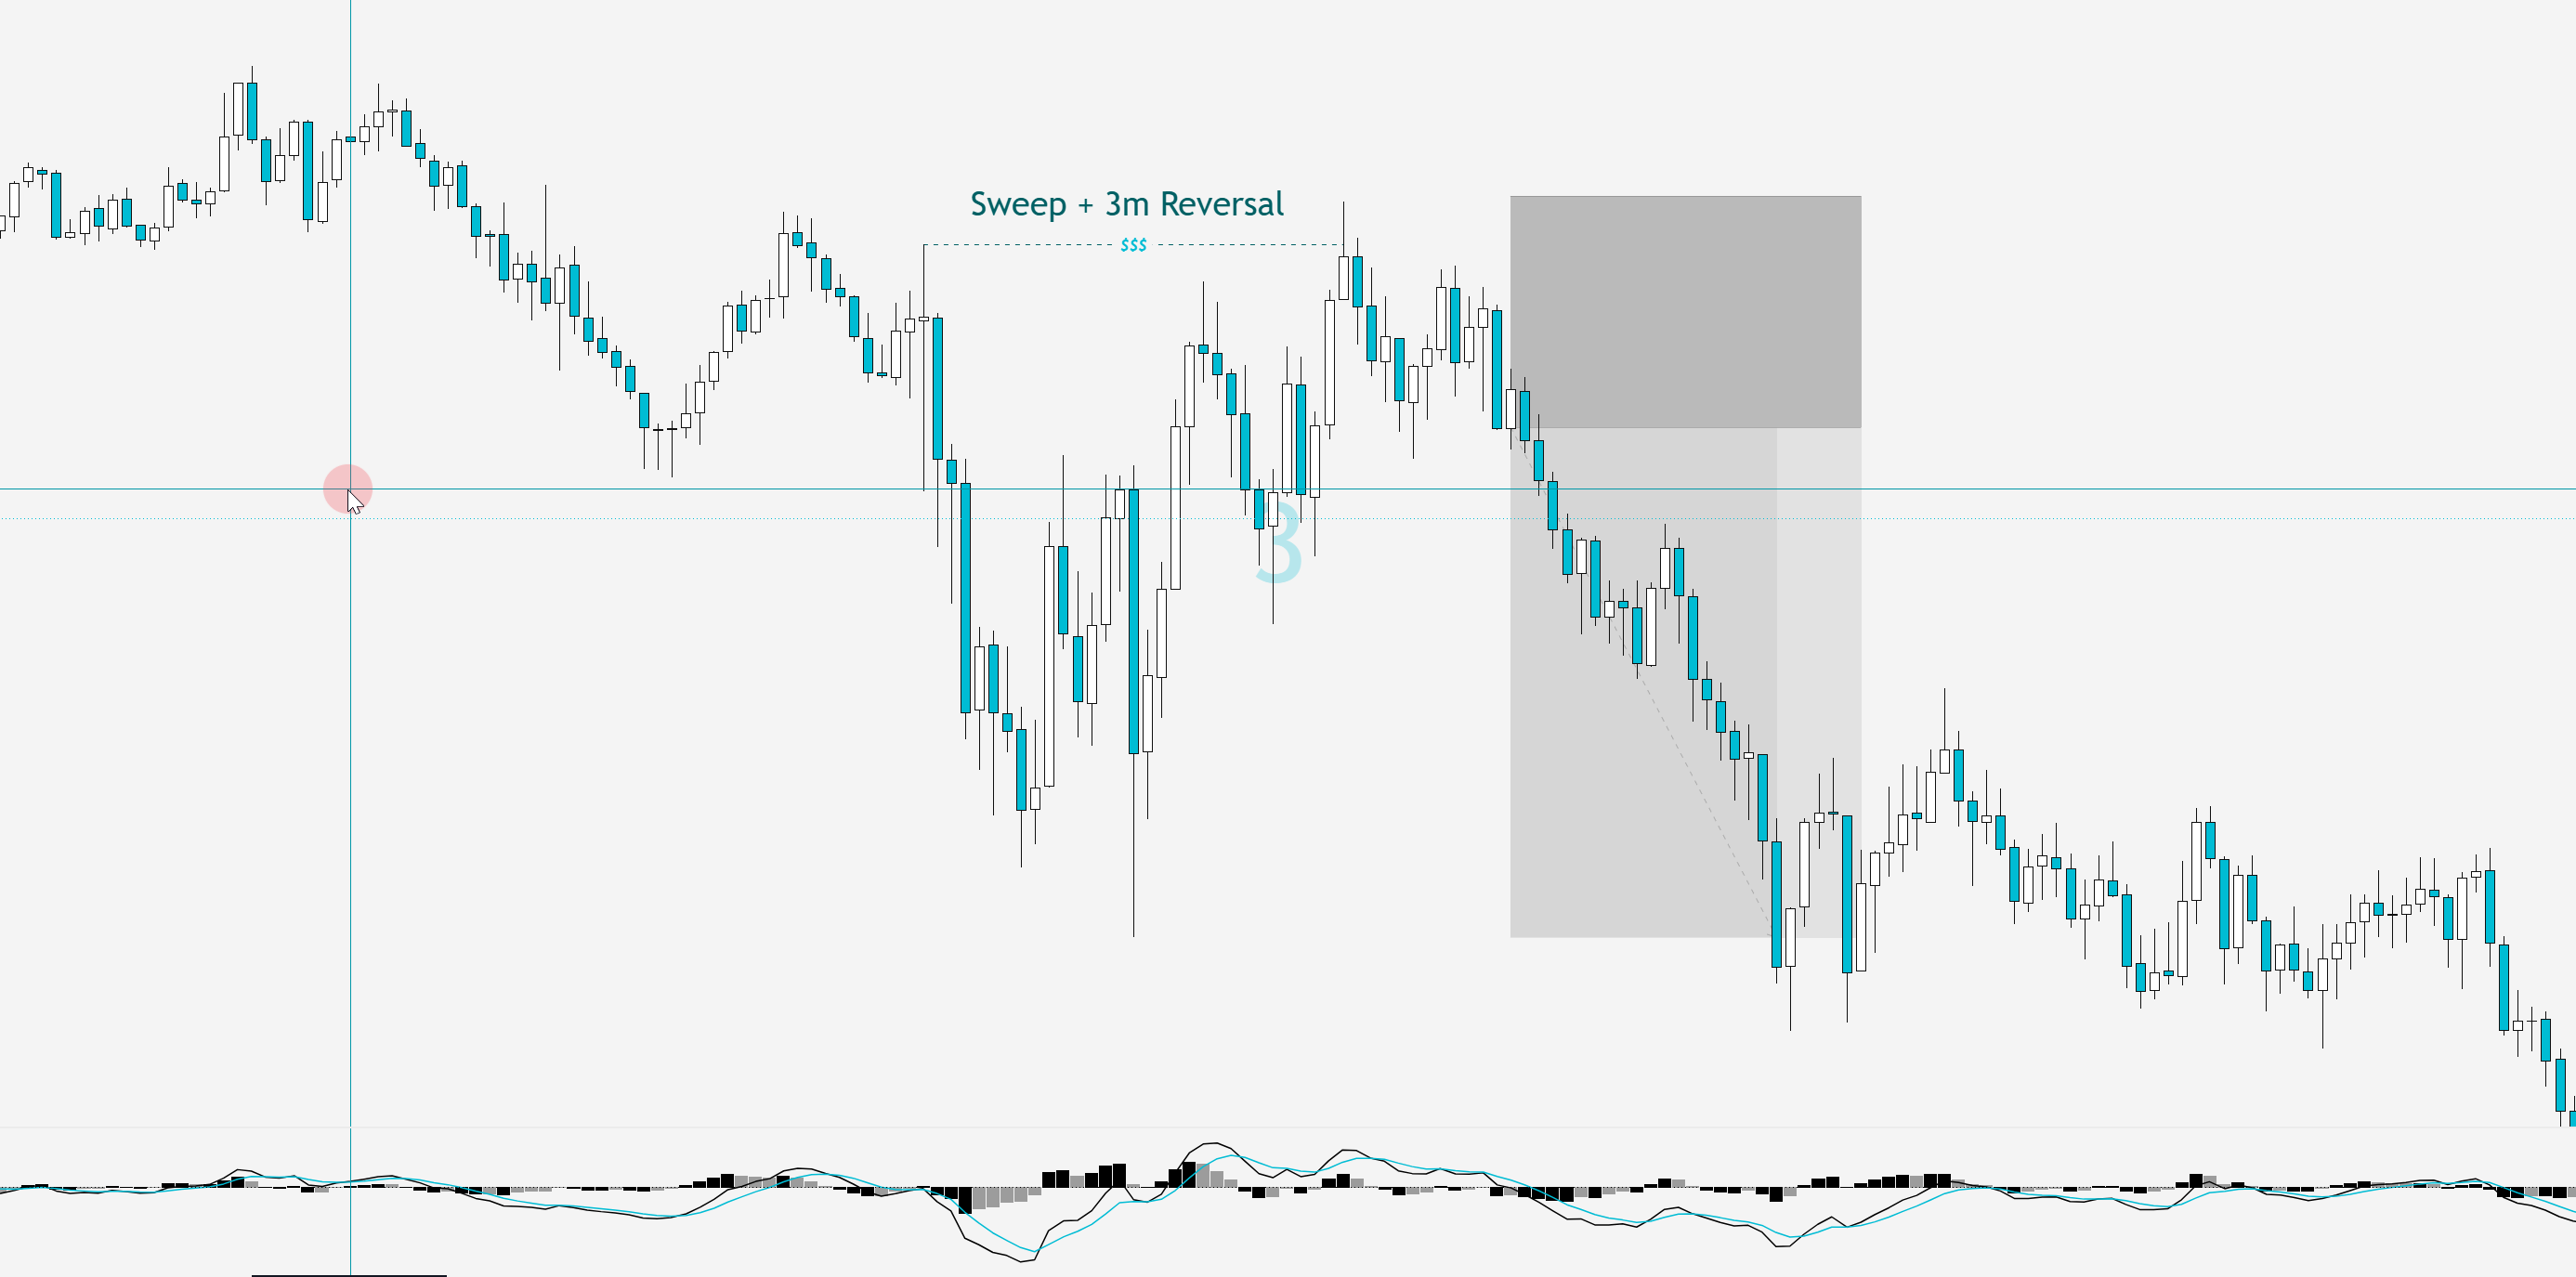
A sweep looks like this in real-time:
- Price approaches one of your mapped levels — say the Previous Day High
- It pushes through that level by a few points
- Long wicks start forming above PDH as buy stops trigger
- Within 1–3 candles, price reverses back below PDH
The key characteristic: price exceeds the level but doesn't hold. It pierces, triggers the resting orders, and snaps back. On a 3-minute chart, this typically shows as a candle (or cluster of candles) with wicks above the level but bodies closing below it.
What you're not looking for: price breaking cleanly through a level and continuing. That's a breakout, not a sweep. Sweeps are defined by the reversal — the rejection after the raid.
Step 4: Confirm the Reversal Candle
After price raids the liquidity level, you need to see a decisive reversal candle:
- For a bearish sweep (price swept above a high): Look for a candle that closes with a full body back below the swept level. Not a doji, not a spinning top — a candle with directional intent.
- For a bullish sweep (price swept below a low): Look for a candle that closes with a full body back above the swept level.
The body close matters. Wicks can be deceiving. A candle that wicks below a level but closes above it hasn't confirmed anything yet.
Step 5: Check for the Follow-Through Setup
A sweep alone isn't a trade. It's the first gate.
After confirming the sweep, the LS Model looks for a rejection out of a level on the 3m — price trades into the FVG (or swing), shows rejection wicks or an engulfing pattern, then closes beyond the recent high or low in the intended direction. That close is the confirmation. Without it, there is no trade.
If no rejection forms after the sweep, there's no setup. This filter is what separates a valid setup from noise.
Common Mistakes When Identifying Sweeps
Calling every wick a sweep. A candle wicking past a level by 0.25 points during low volume isn't a sweep. Genuine sweeps clear the level enough to trigger the cluster of stops — you'll see it in the speed and aggression of the move.
Ignoring session context. A sweep of the Previous Day High at 3:00 AM ET (London session) doesn't carry the same weight as the same sweep at 9:45 AM ET. Time matters.
Looking for sweeps at random levels. If nobody has their stops at a particular price, sweeping it means nothing. Focus on the levels where orders actually cluster: session extremes, prior day extremes, and obvious double-tops/double-bottoms.
Forcing a trade after every sweep. Not every sweep leads to a clean reversal. Sometimes price sweeps a level and chops. The 3m rejection filter exists precisely for this reason — if the market doesn't produce a clean rejection structure after the sweep, there's no setup.
Putting It Together
The checklist:
- Before the session: map PDH, PDL, overnight extremes, session pivots, equal highs/lows
- During the NY AM session (focus on 9:30–11:00 AM ET): watch for price approaching these levels
- When price pierces a level: watch for the reversal candle (body close back through)
- After the reversal: look for the 3m FVG and rejection forming
- If the rejection closes beyond the recent high/low: that's a valid setup trigger
This is the exact sequence the LS Model runs through. Every valid setup has passed all five of these gates.
New to the methodology? Start with What Is a Liquidity Sweep? for the conceptual foundation, then What Is a Fair Value Gap? for how FVGs feed into the entry mechanism. Or join the LSTrades Discord to watch these setups play out live.
Free: the NY-open checklist
Get the session-prep checklist I run before the New York open.
The exact pre-market routine: the 30m read, the level, the risk rules, the debrief. Plus The NQ Edge letter. No hype.
VIP signals are free with Exness
My trades and our bot's trades, in your Telegram.
Entry, stop, targets, and the management as it happens, losses included. Free with an Exness account under the partnership.