
The journal: education
Top-Down Analysis: How the 30m Sets Up the 3m Entry
Every LS Model trade starts before the entry chart. It starts on the 30-minute — the timeframe that decides whether there's anything to trade at all.
This process is called top-down analysis. It's not optional. It's the first step of the methodology.
What Top-Down Analysis Means
Top-down analysis means reading the market from higher timeframe to lower timeframe, in that order. You establish context first, then zoom into the execution timeframe to find your entry.
The logic is straightforward: a 3-minute chart can show you a clean-looking rejection. But if that rejection is fighting a 30-minute downtrend, you're taking a counter-trend trade with the wind in your face. Top-down analysis stops that from happening.
In the LS Model, the process is deliberately short:
- Read the 30m trend — two or more breaks of structure in one direction over the past 2–3 trading days, each confirmed by a candle body close beyond the prior swing
- Mark the 30m levels — every unmitigated Fair Value Gap within the trend leg, plus the last swing before the latest break (taken from candle bodies, not wicks)
- Drop to the 3m — wait for price to pull back into a marked level and print a rejection
- Enter on confirmation — a 3m body close beyond the recent high or low in your direction. No close, no trade
Why Only Two Timeframes
Most top-down frameworks stack 4-hour, 1-hour, and 15-minute charts before execution. The LS Model deliberately doesn't. The 30m is the top timeframe — there is no higher filter above it.
The reason is decision quality. Every additional timeframe is another chart that can disagree, another reason to hesitate, another input to rationalize with. Two timeframes with strict rules beat five timeframes with vibes:
- The 30m answers one question: is there a trend, and where are the levels? If the structure is mixed or ranging, there is no trade — that's the no-trade condition, and it does more for your equity curve than any extra chart.
- The 3m answers one question: has price rejected from the level with a confirmation close?
That's the whole stack. Context, then trigger.
What the 30m Tells You
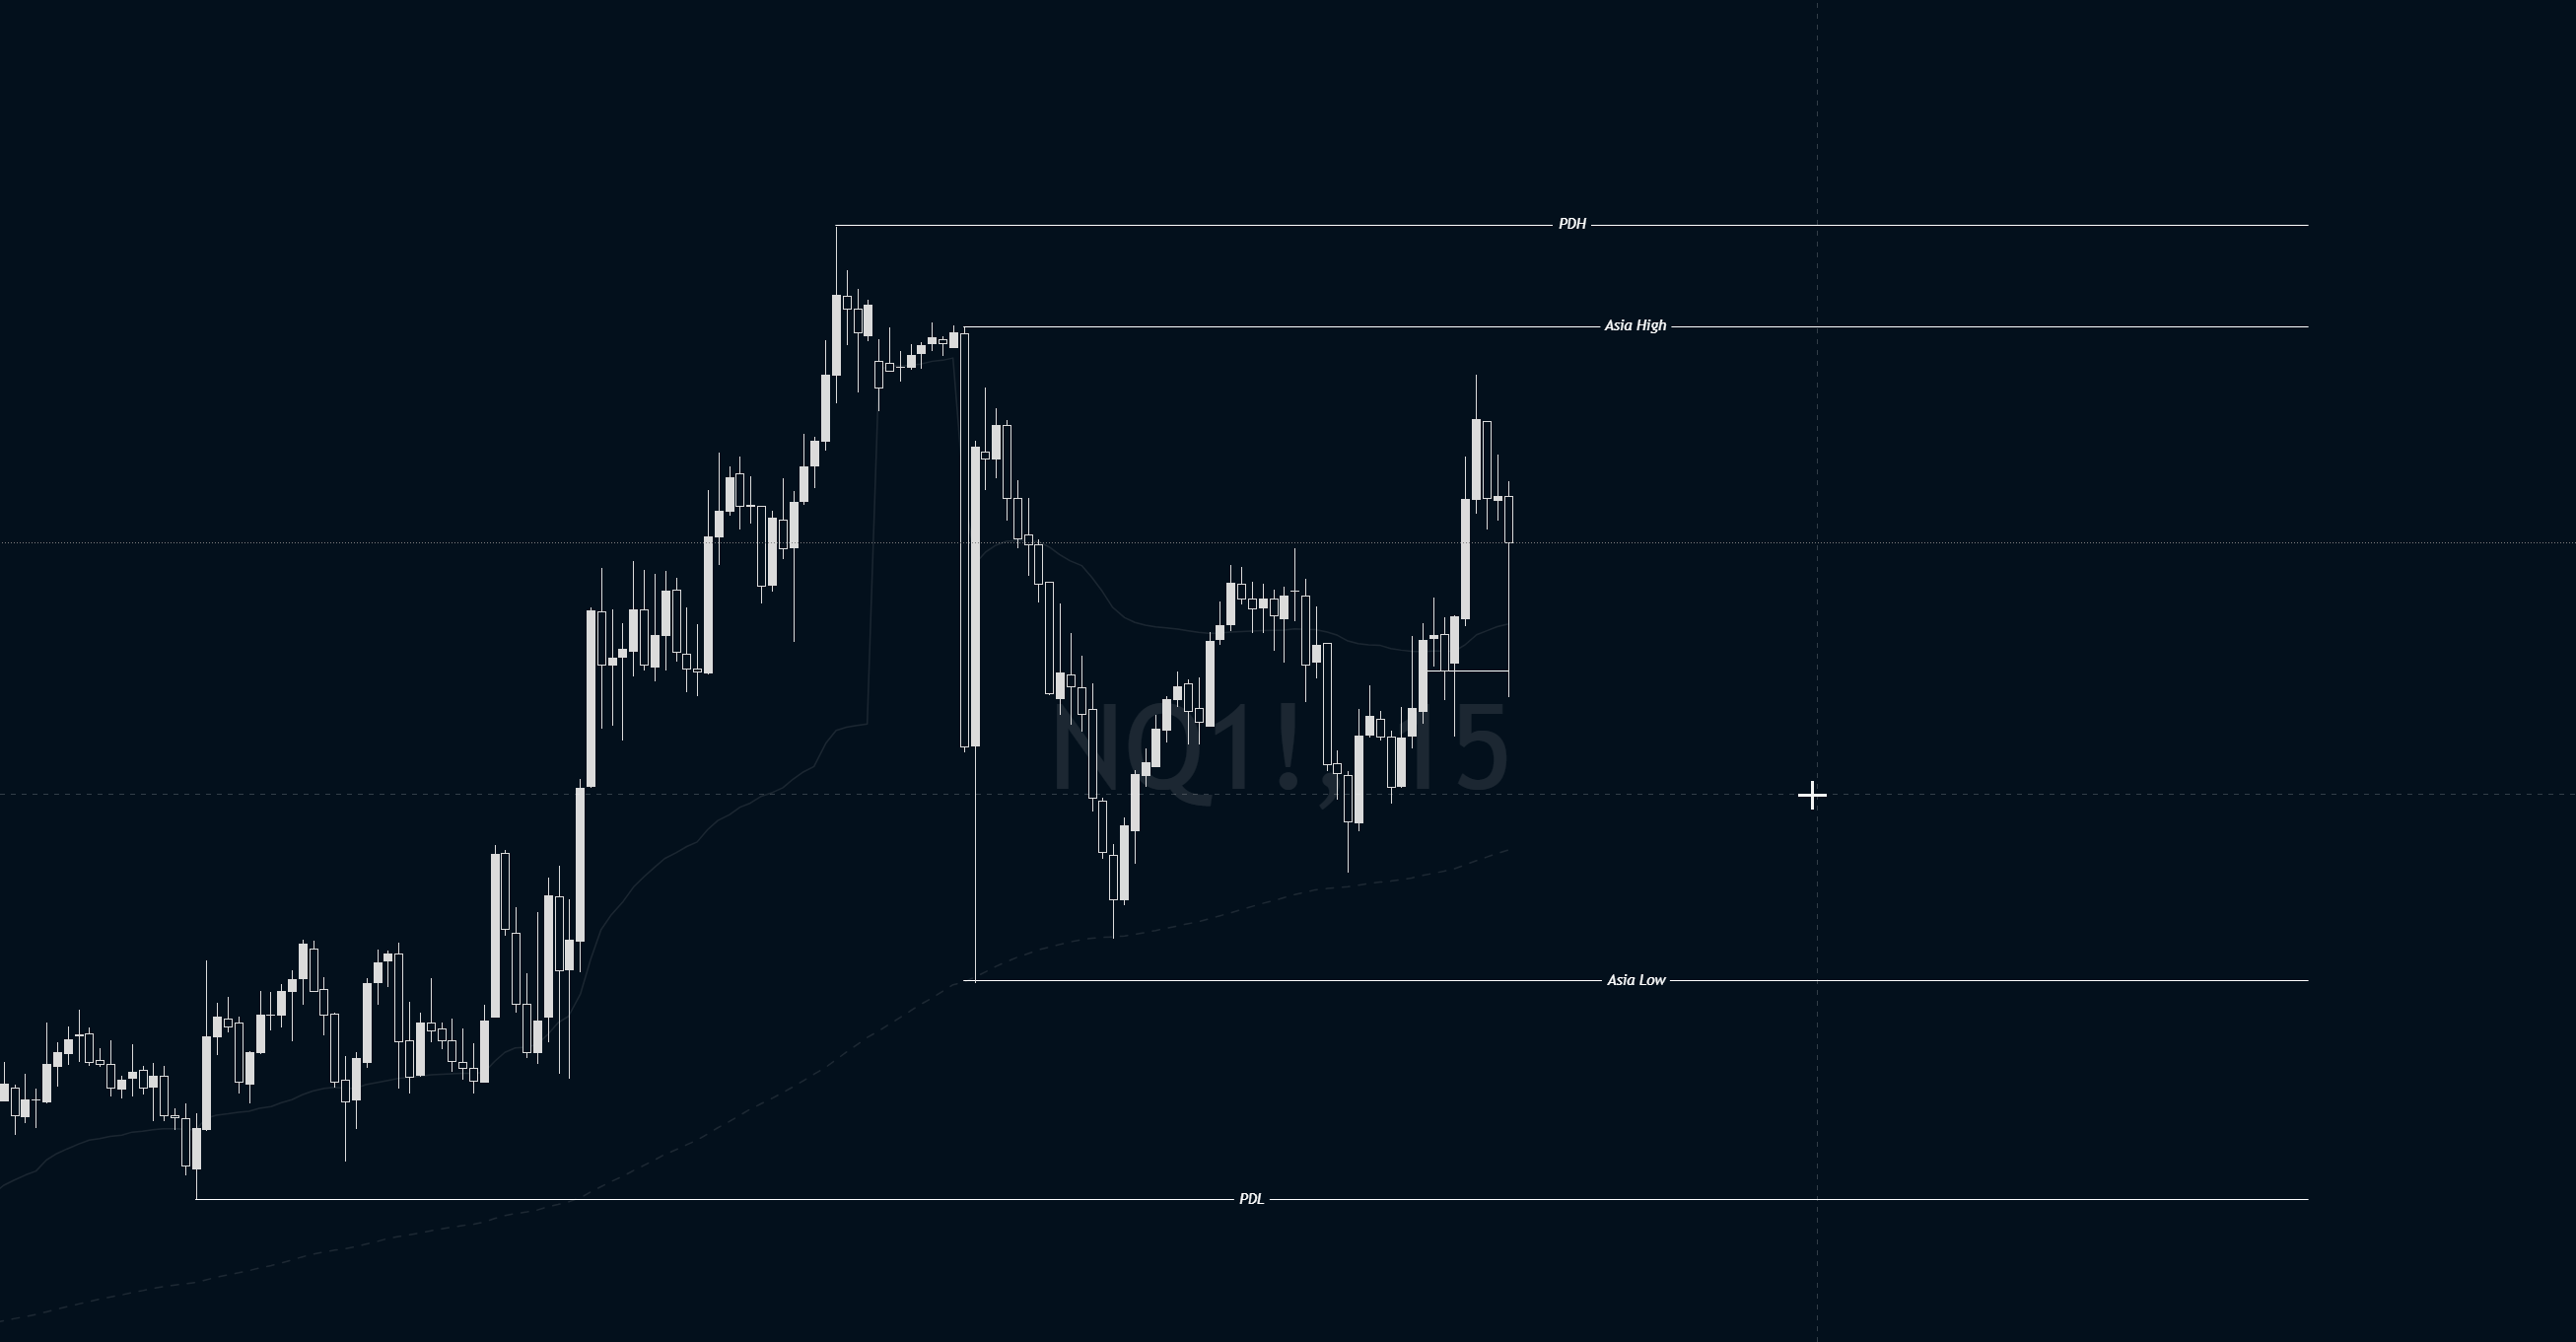
Trend direction. Repeated, same-direction breaks of structure are the trend. One break is noise; two or more over a few days is a leg you can work with. The latest confirmed break is your reference point.
Where the levels are. Unmitigated FVGs within the leg are the entry zones — and the ones sitting in the right half of the leg are higher probability: the lower half (discount) in a bullish leg, the upper half (premium) in a bearish one. A gap that forms after the swing signals momentum, and price will often return to the gap rather than the swing.
Where liquidity sits. Prior swing highs and lows are liquidity pools — and the next opposing pool is the trade's target. Mapping it before the session tells you whether a setup can clear its risk-to-reward floor before you ever take it.
The 3m Execution Layer
Once the 30m context is set, the 3m is where the trade happens:
- Price pulls back into the marked level
- Rejection appears — rejection wicks, an engulfing candle
- A 3m body closes beyond the recent high/low in the trade's direction — that close is the trigger
- The stop goes at the developing 3m structure; the target is the next opposing liquidity
The 3m gives you precision. The 30m gives you conviction. A setup with both is a trade; a setup with only one is a pass.
Common Mistake: Trading the 3m Without the 30m
The most common error in Nasdaq trading is seeing a clean lower-timeframe pattern and entering without checking the higher timeframe.
What happens:
- A clean 3m rejection appears
- Trader enters long
- Price pops, then stalls
- The 30m shows the leg is bearish and an unmitigated gap sits directly overhead
- Price reverses into the stop
The 3m pattern was technically there. But there was no 30m trend behind it and no level under it — so under the LS Model it was never a trade in the first place.
How This Connects to the Entry Types
Top-down analysis isn't separate from the LS Model — it is the model's first two phases. The three entry types are just different relationships between the 30m context and the 3m execution:
- Continuation — the 30m trend holds; price pulls back into the level and resumes. With-trend, floor 1:2, ideally 1:3.
- Bias Flip — price runs through all the marked levels and builds 3m structure against the old direction; entry off the closest remaining FVG. Capped at 1:2.
- Opening Drive — price opens and rips; the first 3m FVG, a tap and reject into a BOS, a fast 1:1.
The Continuation is covered in full in The Continuation Entry, and the reversal in What Is a Bias Flip?.
Understanding the full setup sequence: What Is a Break of Structure? explains the 30m confirmation, and What Is a Fair Value Gap? covers the levels. Or join the free Discord and watch the top-down read play out in real time.
Free: the NY-open checklist
Get the session-prep checklist I run before the New York open.
The exact pre-market routine: the 30m read, the level, the risk rules, the debrief. Plus The NQ Edge letter. No hype.
VIP signals are free with Exness
My trades and our bot's trades, in your Telegram.
Entry, stop, targets, and the management as it happens, losses included. Free with an Exness account under the partnership.